17 Supplementary Figure 12
17.1 Summary
This is the accessory documentation of Supplementary Figure 12.
The Figure can be recreated by running the R script S12.R:
cd $WORK/3_figures/F_scripts

Rscript --vanilla S12.R
rm Rplots.pdf
17.2 Details of S12.R
In principal the S12.R script is a reduced versions of the S03.R script. Is an executable R script that depends on a variety of image manipulation and data managing packages.
For a detailed documentation please refer to F2.R and S03.R.
In the following the differences to S03.R are highlighted. Obvious changes (different data input files, axis labels, y range) are omitted.
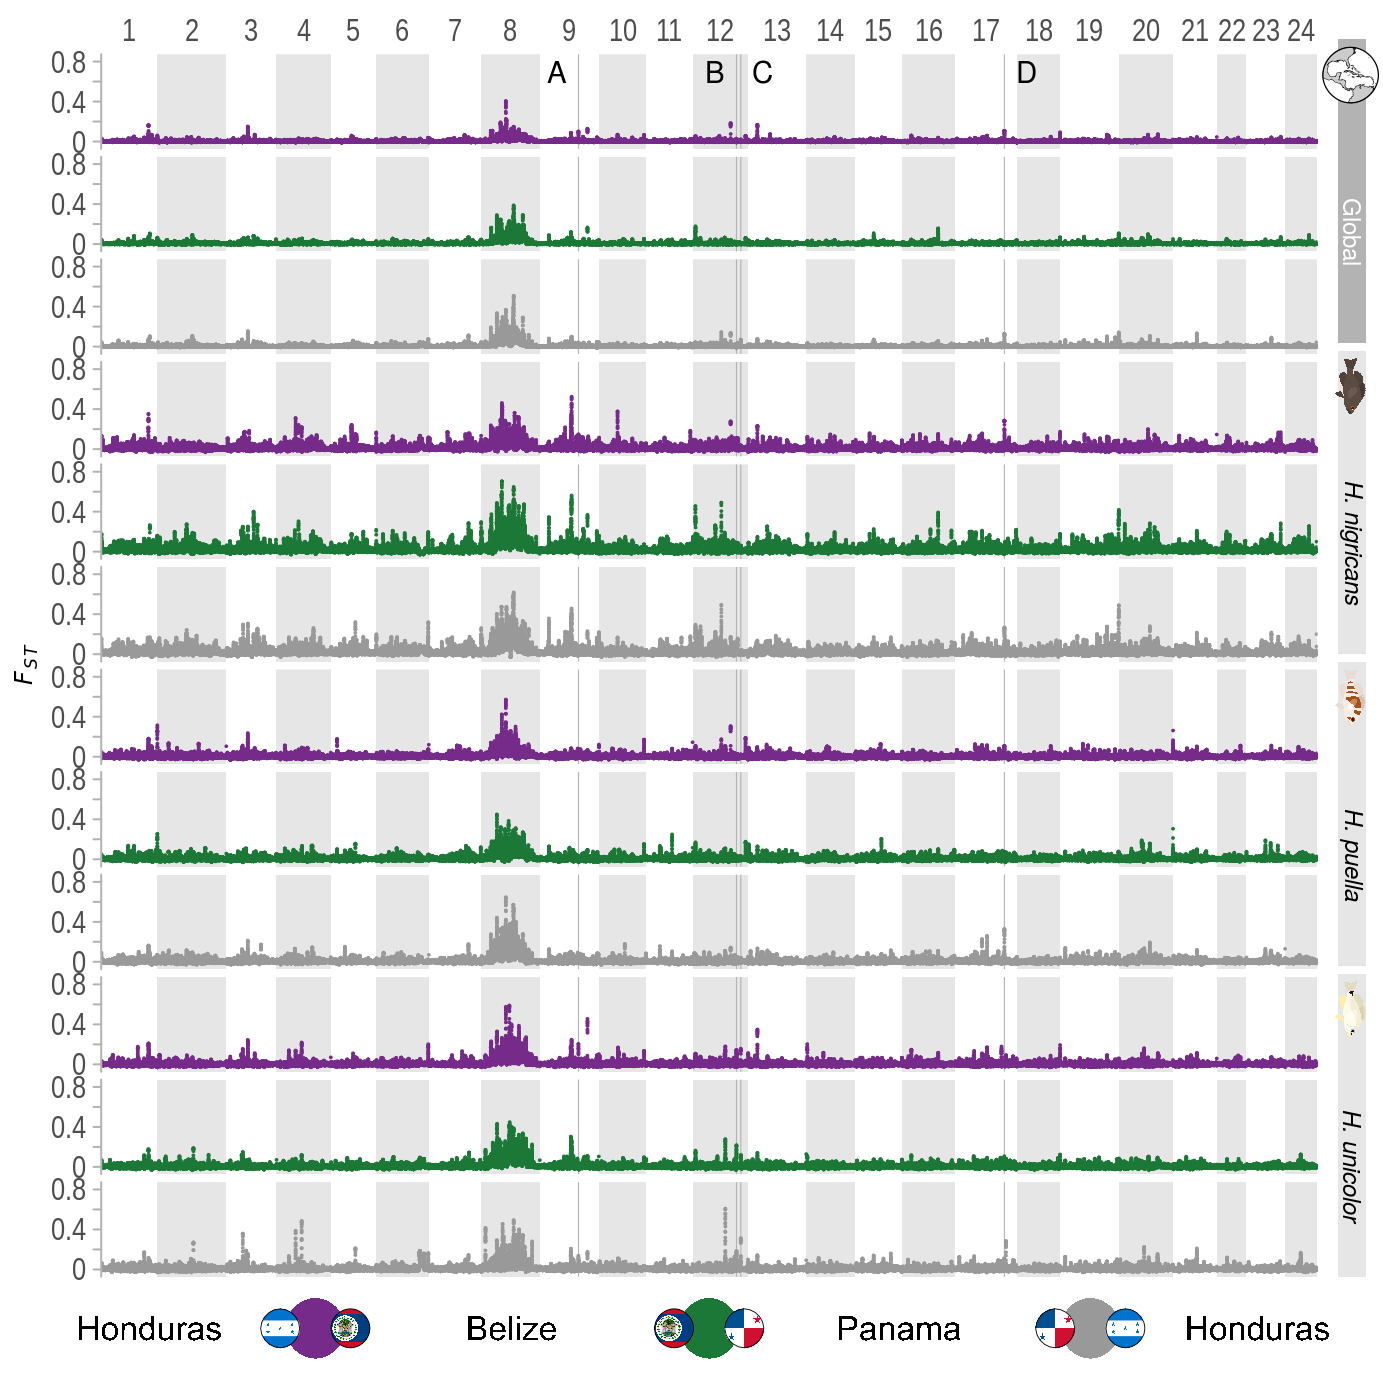
Apart from these trivial changes, Supplementary Figure 09 shows comparisons of different locations while Supplementary Figure 03 shows comparisons of different species. Therefore the color scheme of the two figures differs:
Supplementary Figure 12:
Supplementary Figure 03:
This is done by changing the clr vector and by reading in a different external legend:
#....#
clr <- c('#762a89','#1b7837','#999999')
#....#
legGrob <- gTree(children=gList(pictureGrob(readPicture("../../0_data/0_img/legend-adaptation-cairo.svg"))))
#....#
Comparing to the original script (S03.R):
#....#
clr <- c('#fb8620','#d93327','#1b519c')
#....#
legGrob <- gTree(children=gList(pictureGrob(readPicture("../../0_data/0_img/legend-pw-cairo.svg"))))
#....#