14 Supplementary Figure 09
14.1 Summary
This is the accessory documentation of Supplementary Figure 09.
The Figure can be recreated by running the R script S09.R:
cd $WORK/3_figures/F_scripts

Rscript --vanilla S09.R
rm Rplots.pdf
14.2 Details of S09.R
The S09.R script is basically a variant of the F3.R script. Is an executable R script that depends on a variety of image manipulation and data managing and genomic data packages.
It Furthermore depends on the R scripts F3.functions.R,F3.plot_fun.R which themselves depend on F3.getDXY.R and F3.getFSTs.R (both located under $WORK/0_data/0_scripts).
The script uses the same function (create_K_plot()) of the F3.functions.R script. Only the settings when calling the function (genomic ranges and genes of interest) are adjusted:
#....#
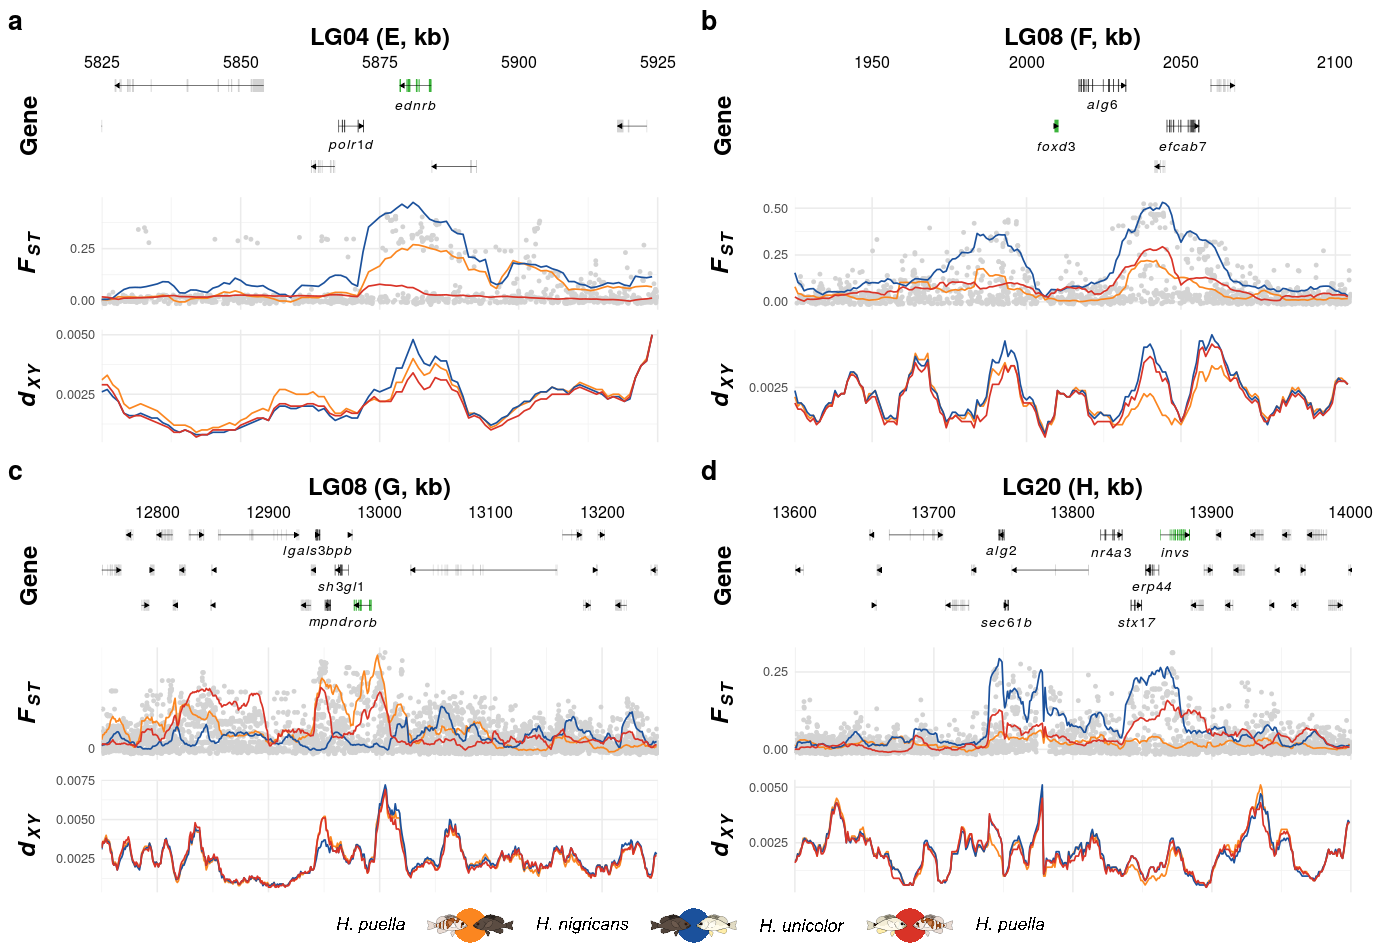
p5 <- create_K_plot(searchLG = "LG04",gfffile = '../../1-output/09_gff_from_IKMB/HP.annotation.named.gff',
xr = c(5825000, 5925000),
searchgene = c("EDNRB_0"),
secondary_genes = c("polr1d"),
searchsnp = c(),muskID = 'E')
p6 <- create_K_plot(searchLG = "LG08",gfffile = '../../1-output/09_gff_from_IKMB/HP.annotation.named.gff',
xr = c(1925000,2105000),
searchgene = c("foxd3-a"),
secondary_genes = c("ALG6","EFCAB7"),
searchsnp = c(),
muskID = 'F')
p7 <- create_K_plot(searchLG = "LG08",gfffile = '../../1-output/09_gff_from_IKMB/HP.annotation.named.gff',
xr = c(12750000,13250000),
searchgene = c("RORB"),
secondary_genes = c("lgals3bpb","mpnd","SH3GL1_0"),
searchsnp = c(),
muskID = 'G')
p8 <- create_K_plot(searchLG = "LG20",gfffile = '../../1-output/09_gff_from_IKMB/HP.annotation.named.gff',
xr = c(13600000,14000000),
searchgene = c("invs"),
secondary_genes = c("ALG2","SEC61B","NR4A3",
"STX17","ERP44"),
searchsnp = c(),muskID = 'H')
#....#Here, for comparison, the original within F3.R:
#....#
p1 <- create_K_plot(searchLG = "LG09",gfffile = '../../1-output/09_gff_from_IKMB/HP.annotation.named.gff',xr = c(17800000,18000000),
                    searchgene = c("SOX10_1"),secondary_genes = c("RNASEH2A"),searchsnp = c(17871737,17872597,17873443),
                    muskID = 'A')
p2 <- create_K_plot(searchLG = "LG12",gfffile = '../../1-output/09_gff_from_IKMB/HP.annotation.named.gff',xr = c(20080000,20500000),
                    searchgene = c("Casz1_2"),secondary_genes = c(),searchsnp = c(20316944,20317120,20323661,20323670,20333895,20347263),
                    muskID = 'B')
p3 <- create_K_plot(searchLG = "LG12",gfffile = '../../1-output/09_gff_from_IKMB/HP.annotation.named.gff',xr = c(22100000,22350000),
                    searchgene = c("hoxc13a"),secondary_genes = c('hoxc10a',"hoxc11a","hoxc12a","calcoco1_1"),
                    searchsnp = c(),
                    muskID = 'C')
p4 <- create_K_plot(searchLG = "LG17",gfffile = '../../1-output/09_gff_from_IKMB/HP.annotation.named.gff',xr = c(22500000,22670000),
                    searchgene = c('LWS',"SWS2abeta","SWS2aalpha","SWS2b"),searchsnp = c(22553970,22561903,22566254),
                    secondary_genes = c("Hcfc1","HCFC1_2","HCFC1_1","GNL3L","TFE3_0","MDFIC2_1","CXXC1_3","CXXC1_1",'Mbd1','CCDC120'),
                    muskID = 'D')
#....#