16 Supplementary Figure 11
16.1 Summary
This is the accessory documentation of Supplementary Figure 11.
The Figure can be recreated by running the R script S11.R:
cd $WORK/3_figures/F_scripts

Rscript --vanilla S11.R
rm Rplots.pdf
16.2 Details of S11.R
The S11.R script is basically a variant of the F4.R script. Is an executable R script that depends on a variety of image manipulation and data managing and genomic data packages.
It Furthermore depends on the R scripts S11.functions.R (which is itself a variant of F4.functions.R , both located under $WORK/0_data/0_scripts).
The difference to the original (F4.R) is the extended number of genomic ranges considered, as well as the extend of the respective regions. Furthermore, the box plot sub figures are omitted in this version.
Otherwise, the setup of S11.R is exactly equivalent to the original script with adjusted scaling and labeling definitions. These adjustments are located within the S11.functions.R script.
Here as an example the expanded scaling vector:
#....#
  s1=5760000;s2=1884000;s3=12860000;s4=17745000;s5=20149000;s6=22085000;s7=22445000;s8=13730000
  e2=2134000;e3=13110000;e5=20399000;e6=22335000
  stp=20000;lALL=250000

  scling <- c(-s1,
              -s2+(lALL+stp),
              -s3+((lALL+stp)*2),
              -s4+((lALL+stp)*3),
              -s5+((lALL+stp)*4),
              -s6+((lALL+stp)*5),
              -s7+((lALL+stp)*6),
              -s8+((lALL+stp)*7))
#....#
This replaces the original section:
#....#
  s1=17620000;s2=19910000;s3=21960000;s4=22320000;
  e2=20660000;e3=22460000;
  stp=20000;
  l1=500000;l2=750000;l3=500000;l4=500000
  scling <- c(-s1,-s2+(l1+stp),-s3+(l1+l2+2*stp),-s4+(l1+l2+l3+(stp*3)))
#....#
Another example is the definition of expanded gene selection:
#....#
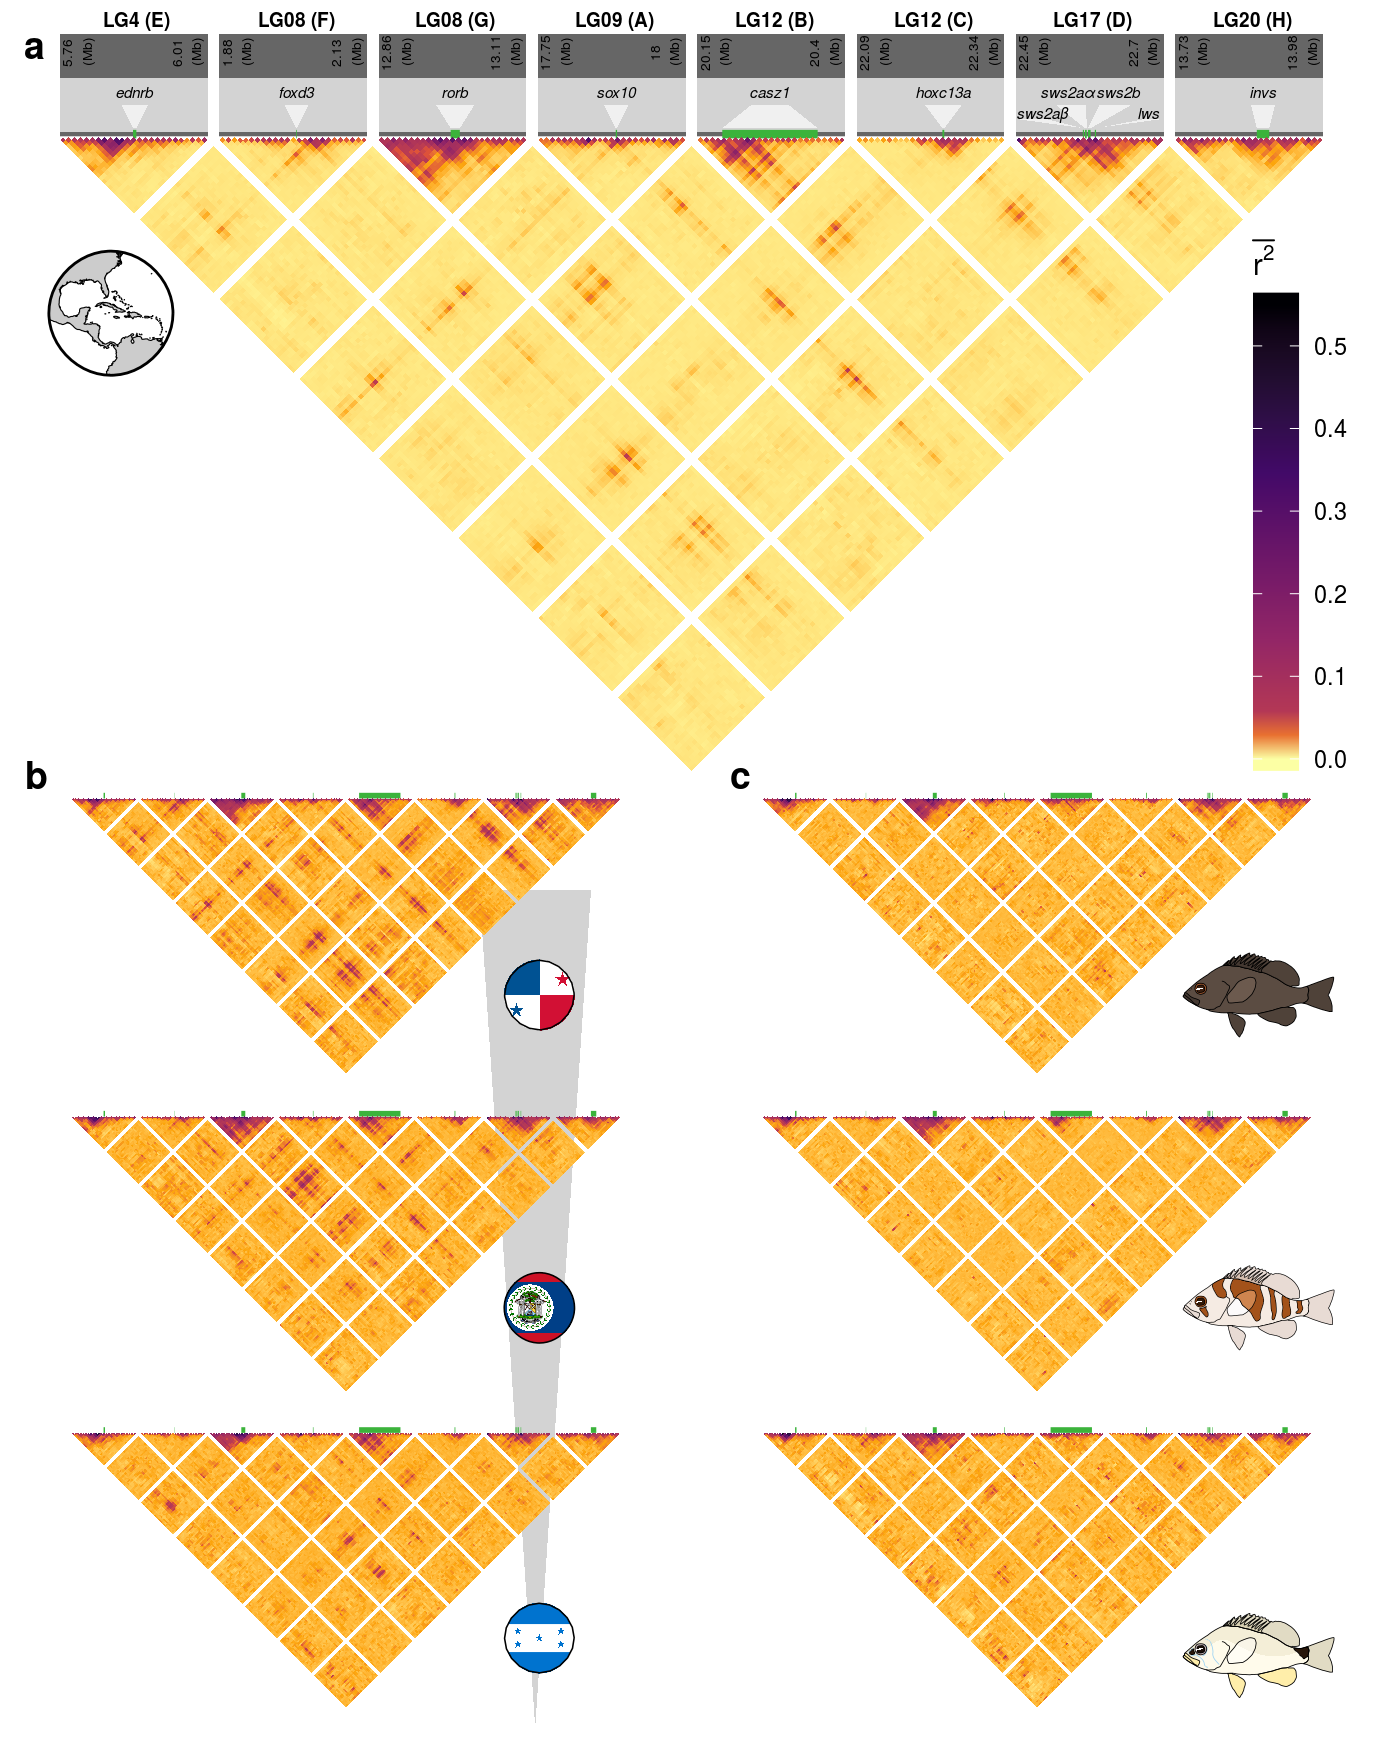
genes <- data.frame(start=c(5884279,2009113,12992396,17871610,20186151,22228342,22553187,22556763,22561894,22573388,13862931),
end=c(5878614,2010303,12976894,17873915,20347811,22225149,22555052,22559742,22566321,22575503,13884003),
sclr=c(1,2,3,4,5,6,7,7,7,7,8),
LG=c("LG04","LG08","LG08","LG09","LG12","LG12","LG17","LG17","LG17","LG17","LG20"),
name=c("ednrb","foxd3","rorb","sox10","casz1","hoxc13a","sws2a\u03B2","sws2a\u03B1","sws2b","lws","invs"))
#....#This replaces the more restricted original selection:
#....#
  genes <- data.frame(start=c(17871610,20186151,22225149,22553187,22556763,22561894,22573388),
                      end=c(17873915,20347811,22228342,22555052,22559742,22566321,22575503),
                      sclr=c(1,2,3,4,4,4,4),
                      LG=c("LG09","LG12-1","LG12-2","LG17","LG17","LG17","LG17"),
                      name=c("sox10",'casz1',"hoxc13a","sws2a\u03B1","sws2a\u03B2","sws2b","lws"))
#....#
Analogous replacements continue throughout the S11.functions.R script.
For detail of the individual steps required to produce this figure please refer to the documentation of the original version (Figure 4, F4.functions.R).