hypo_anno_l adds a left facing hamlet annotation to a ggplot.
hypo_anno_l(species, xmin = -Inf, xmax = Inf, ymin = -Inf, ymax = Inf)
Arguments
| species | string scalar (manatory), one of "aberrans","atlahua", "castroaguirrei","chlorurus","ecosur","floridae","gemma","gummigutta", "guttavarius","indigo","liberte","maculiferus","maya","nigricans", "providencianus","puella","randallorum","tan","unicolor" |
|---|---|
| xmin | numeric scalar (optional), left boundary of the annotation |
| xmax | numeric scalar (optional), right boundary of the annotation |
| ymin | numeric scalar (optional), lower boundary of the annotation |
| ymax | numeric scalar (optional), upper boundary of the annotation |
Details
Hypogen comes with a set of illustrations of differnt halmet species.
The function hypo_anno_l uses the ggplot2::annotation_custom()
function to add a single left facing hamlet to an existring ggplot.
See also
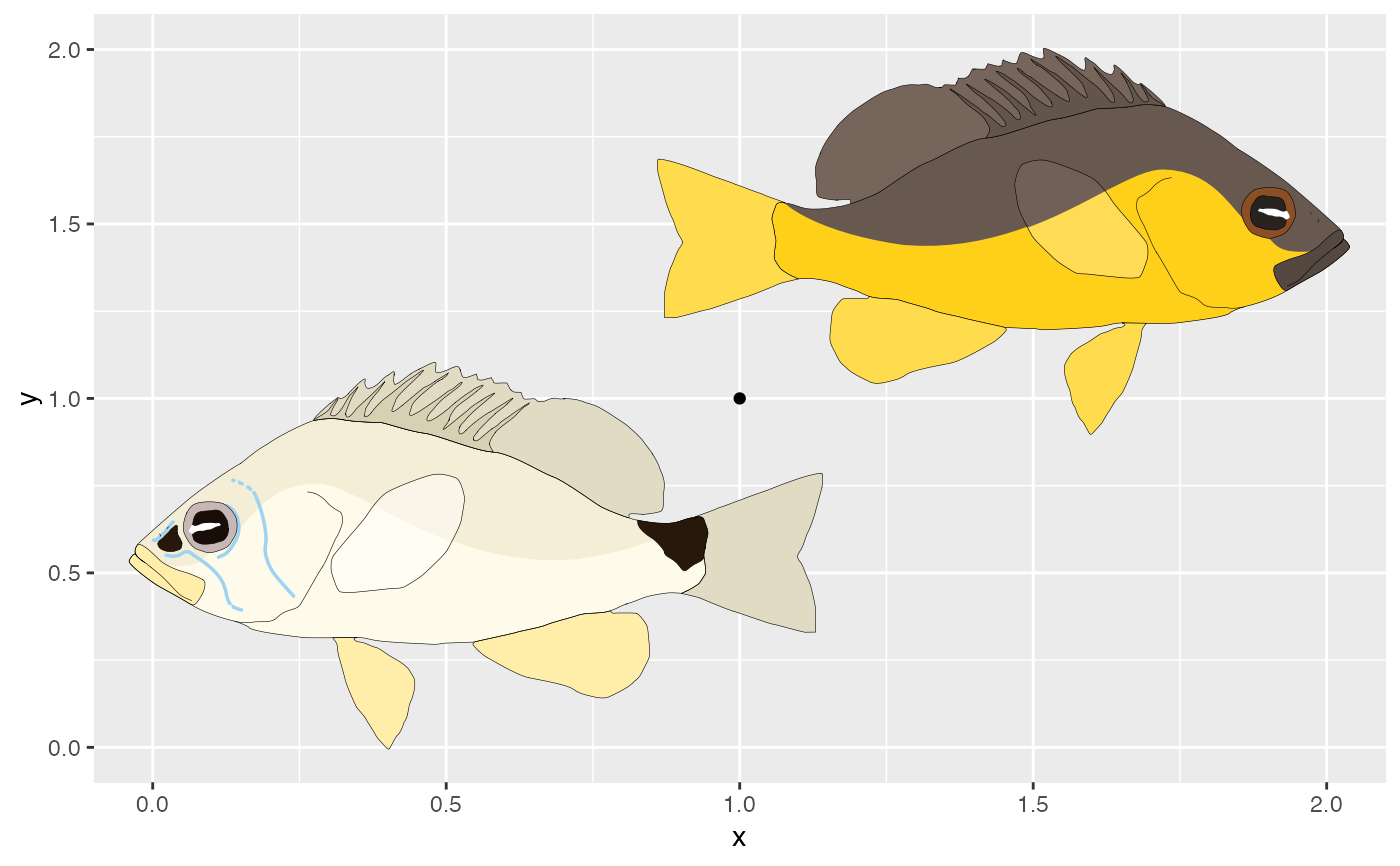
Examples
ggplot(tibble(x = 1, y = 1),
aes(x = x, y = y))+
   geom_point()+
   hypo_anno_l('unicolor', xmax = 1.2, ymax = 1.2)+
   hypo_anno_r('aberrans', xmin = .8, ymin = .8)+
   coord_cartesian(xlim = c(0, 2), ylim = c(0, 2))