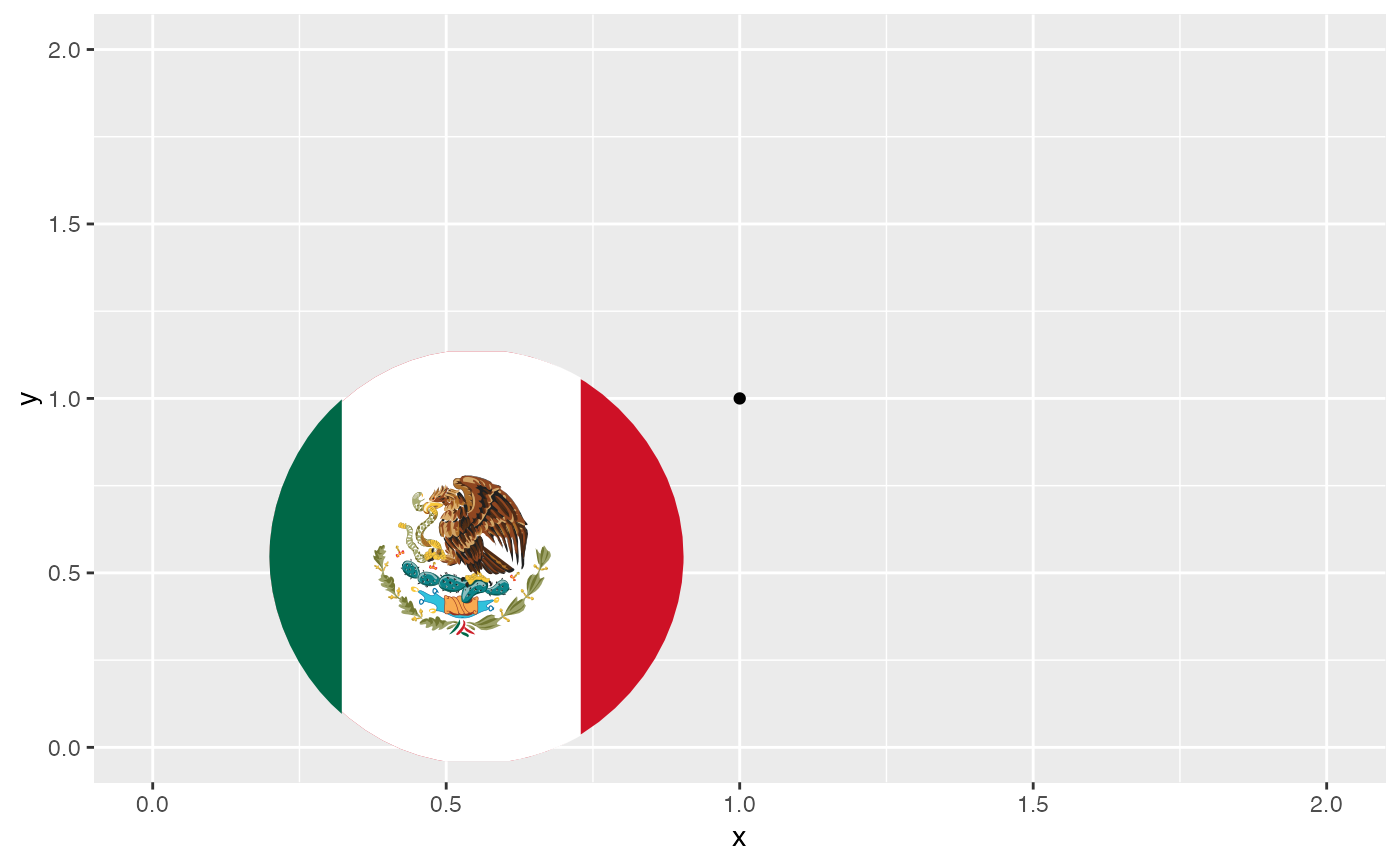
hypo_anno_flag adds a left facing hamlet annotation to a ggplot.
hypo_anno_flag(geo, xmin = -Inf, xmax = Inf, ymin = -Inf, ymax = Inf, ...)
Arguments
| geo | string skalar (manatory), one of the available flag IDs |
|---|---|
| xmin | numeric skalar (optional), left boundary of the annotation |
| xmax | numeric skalar (optional), right boundary of the annotation |
| ymin | numeric skalar (optional), lower boundary of the annotation |
| ymax | numeric skalar (optional), upper boundary of the annotation |
| ... | catch all parameter to allow excess parameter through purrr::pmap |
Details
Hypogen comes with a set of illustrations of flags of the countries adjacent
to the Caribbean and the Golf of Mexico.
The function hypo_anno_flag uses the ggplot2::annotation_custom()
function to add a single flag to an existring ggplot.
See also
Examples
ggplot(tibble(x = 1, y = 1), aes(x = x, y = y))+
  geom_point()+
  hypo_anno_flag('mexico', xmax = 1.2, ymax = 1.2)+
  coord_cartesian(xlim = c(0, 2), ylim = c(0, 2))