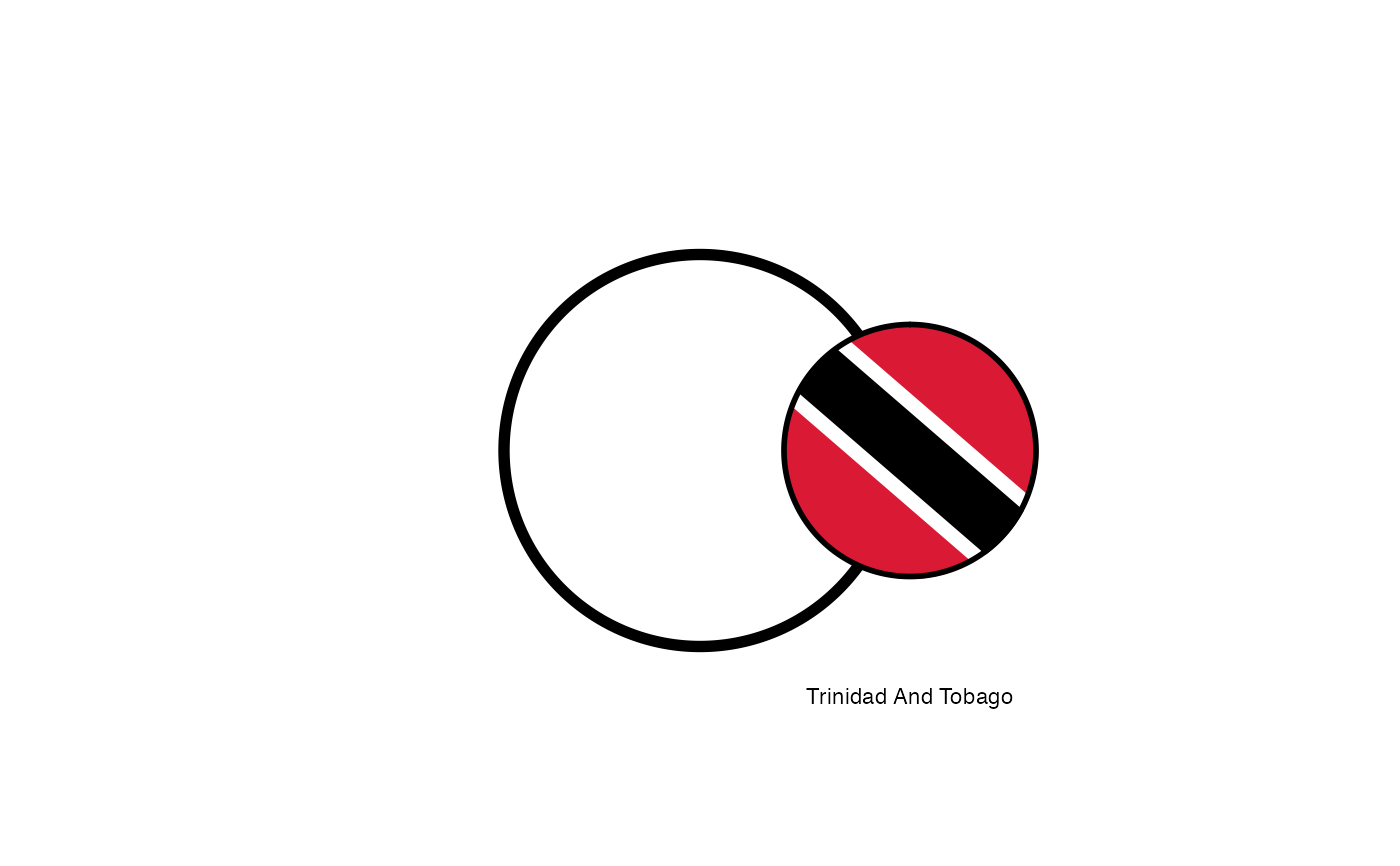
hypo_anno_flag_single combines a single flag with a colored circle
hypo_anno_flag_single(
  geo,
  flag_lwd = 1,
  flag_line_color = NA,
  flag_radius_scale = 1,
  circle_color = NA,
  circle_fill = "white",
  circle_lwd = 0.5,
  plot_names = FALSE,
  plot_name_size = 3,
  font_family = "sans",
  ...
)
Arguments
| geo | string skalar (manatory), one of the available flag IDs |
|---|---|
| flag_lwd | numeric skalar (optional), line width of the optional frame of the flag annotation |
| flag_line_color | color skalar (a string, optional), line width of the optional frame of the flag annotation |
| flag_radius_scale | numeric skalar (optional), scaling of the optional flag annotation frames diameter |
| circle_color | color skalar (a string, optional), the color of the background circle outline |
| circle_fill | color skalar (a string, optional), the fill of the background circle |
| circle_lwd | numeric skalar (optional), the width of the background circle outline |
| plot_names | logical skalar (optional), should the species label be added? |
| plot_name_size | numeric skalar (optional), the species label size |
| font_family | string skalar (optional), the species label font family |
| ... | catch all parameter to allow excess parameter through purrr::pmap |
Details
The function hypo_anno_flag_single provides the basic building
block of the single flag color legend. It combines a single flag
annotaion with a background circle which can be coloured.
Aditionally, the flag label can be added to the plot.
See also
Examples
hypo_anno_flag_single(geo = 'trinidad_and_tobago',
  flag_lwd = 1, flag_line_color = 'black', flag_radius_scale = 1,
  circle_color = 'black', circle_lwd = 2, plot_names = TRUE)