Swim hamlet, swim!

Exploring gganimate
What: Using gganimate to create a Super Mario style hamlet video.
I quite liked watching the rstudio::conf2019
talk
by Thomas Lin Pedersen where he introduces the new version of the
gganimate. When he talked about the gganimate::view_follow() it
reminded me quite a bit of old jump’n run games and I got tempted to try
to play around with the package.
Of course I wanted to feature some hamlet stuff - my idea was to create some Super Mario style animation.
To do this I did a little preparation in Inkscape and created a svg file that would later represent the landscape our hamlet has to cross:

I exported the x/y node positions of the individual paths using a neat little Inkscape extension (by user Neon22).
I did the same for a slightly modified version of my signature hamlet where I opened all existing holes in the polygons.
Than it was time to start R:
library(tidyverse)
library(gganimate)
# We also import a small TV as top layer for the plots
screen <- hypoimg::hypo_read_svg('screen-cairo.svg')
We use a small configuration section to define the width our rolling window should have when scrolling through the landscape, as well as the distance between the individual stages of the animation (distance in nodes of the original path).
We also write a small import function for the node positions.
bin_W <- 250
step_W <- 20
pos_l <- 50
pos_r <- bin_W-pos_l

import_svg_coord <- function(file, shift = 0){
read_csv(file, col_names = c('x','y')) %>%
mutate(y=-y+max(y) + shift)
}
Then we load the coordinates of the hamlet, as well as for the different substrates and the swimming path.
fish <-read_tsv('draw_merged.tsv', col_names = c('x','y','id','type')) %>%
mutate(y=-y-min(y),
       y = y/max(x),
       y = y - mean(y),
       x= 1-x/max(x) -.5)

ground <- import_svg_coord('ground.csv', 10)
coral <- import_svg_coord('coral.csv', 10)
grass <- import_svg_coord('grass.csv', 10)
stone <- import_svg_coord('stones.csv', 10)
pth <- import_svg_coord('path.csv', 60)
As a first step of the animation, we divide the swimming path into
chunks of 20 (step_W) nodes and assign stations - those are going to
be the individual steps of the animation.
stations <- pth %>%
mutate(rn = row_number()) %>%
filter(rn > pos_l,
       rn < length(x)-pos_r) %>%
mutate(station = row_number() %/% step_W,
       is_station = (row_number() %% step_W) == floor(step_W/2)) %>%
filter(is_station,
       station > 1,
       station < 87)
Then, we need some functions to extract the region that is covered during each station.
# this function will exctract the spatial extend of each station
get_extent <- function(rn,station,...){
ground %>%
  filter(row_number() > (rn - pos_l),
         row_number() < (rn + pos_r)) %>%
  summarise(start = min(x),
            end = max(x)) %>%
  mutate(station = station)
}

# this function will exctract the nodes of the different substate types
get_ground <- function(rn,ground,station,...){
ground %>%
  filter(row_number() > (rn - pos_l),
         row_number() < (rn + pos_r)) %>%
  mutate(station = station)
}

# this function will exctract the spatial position of the hamlet for each station
get_location <- function(rn,station,...){
pth %>%
  filter(row_number() == rn)  %>%
  mutate(station = station)
}
Then, we transform the hamlet coordinates for each station.
This will put the center of the hamlet onto the location of the selected
node (pos_l).
get_fish <- function(x,y,station,fish_scale=1,...){
X <- x
Y <- y
fish %>%
  mutate(x = x*fish_scale,
         y = y*fish_scale,
         x = x+X,
         y = y+Y,
         station = station,
         station_id = str_c(station,id,sep = '-'))
}
Now, we apply the functions to generate the substrate and extend data sets (with assigned stations).
ground_stations <- stations %>%
purrr::pmap(get_ground, ground = ground) %>%
bind_rows()

coral_stations <- stations %>%
purrr::pmap(get_ground, ground = coral) %>%
bind_rows()

grass_stations <- stations %>%
purrr::pmap(get_ground, ground = grass) %>%
bind_rows()

stone_stations <- stations %>%
purrr::pmap(get_ground, ground = stone) %>%
bind_rows()

location_stations <- stations %>%
purrr::pmap(get_location) %>%
bind_rows()

extend_stations <- stations %>%
purrr::pmap(get_extent) %>%
bind_rows()
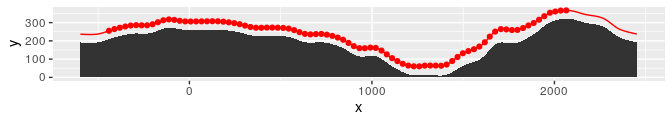
A quick summary of the compiled data sets:
ggplot()+
  coord_equal()+
  geom_area(data = ground, aes(x, y))+
  geom_path(data = pth, aes(x, y), color = 'red')+
  geom_point(data = location_stations,
             aes(x, y, group = station), color = 'red')
Next, we do the hamlet transformations:
fish_stations <- stations %>%
purrr::pmap(get_fish, fish_scale = 40) %>%
  bind_rows()
Finally it’s time to put the pieces together.
ggplot()+
  coord_equal()+
  # hamlets need water
  geom_rect(data = extend_stations, aes(xmin = start,
                                        xmax = end,
                                        ymin = 0,
                                        ymax = 400,
                                        group = station),
            fill = 'blue',alpha = .3)+
  # add substrates
  geom_area(data = stone_stations, aes(x,y,group=station), fill = '#b3b3b3')+
  geom_area(data = grass_stations, aes(x,y,group=station), fill = '#0db010')+
  geom_area(data = coral_stations, aes(x,y,group=station), fill = '#ffb867')+
  # add ground
  geom_area(data = ground_stations, aes(x,y,group=station))+
  # place hamlets
  geom_polygon(data = fish_stations, aes(x=x,y=y, group = station_id, fill = type))+
  # make up
  scale_fill_manual(values = c('1_bg' = "#D3D3D2",
                               '2_line' = 'black'),
                    guide=FALSE)+
  # stage
  theme_void()+
  # "cut !"
  annotation_custom(grob = screen) +
  transition_time(station) +
  gganimate::view_follow()