Splinter fish
Exploring the updates of ggforce (0.2.0.9000)
What: Combining ggforce and hypoimg to create hamlet mosaics.
Recently, Thomas Lin Pedersen released an update of the great package ggforce. On his blog he presents a few cool examples and especially the tessellation stuff looks cool. It got me hooked, so I decided to look at the new features of ggforce and see what they could do to the poor unprepared hamlets…
library(tidyverse)
library(ggforce)
library(sf)
So, first let’s plot the hamlet outline:
hypoimg::hypo_outline %>%
  ggplot(aes(x = x,y = y))+
  coord_equal()+
  geom_shape()
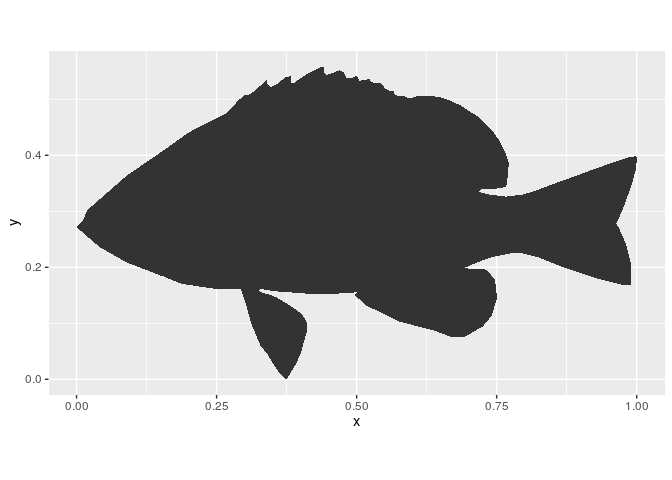
Ok - this seems to work nicely.
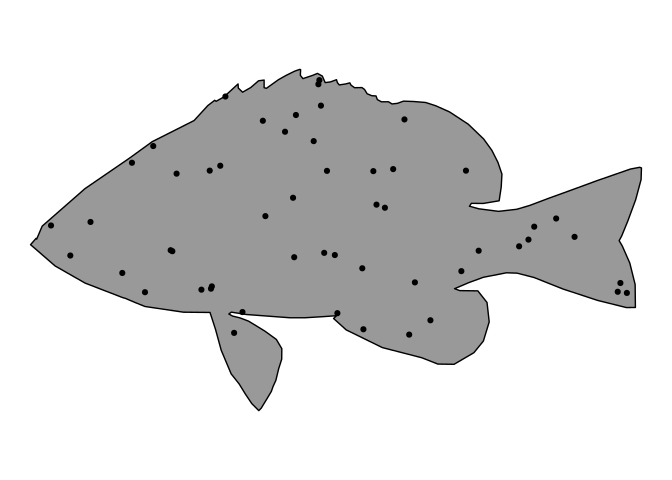
Now we need some random points on our hamlet - the poor fish gets the measles. To do this we first create random points throughout the whole x and y range of the fish.
Then we are going to turn both the points and the outline into a spatial object and intersect them.
For convenience we wrap this up in a function:
create_inner_points <- function(n = 170, data){
# turn the outline into spatial object
spatial_outline <- data %>%
    as.matrix() %>%
    list(.) %>%
    st_polygon(.)

# create random points and turn them into spatial object
spatial_points <- tibble(x = runif(n,min = min(data$x),max = max(data$x)),
                y = runif(n,min = min(data$y),max = max(data$y))) %>%
  as.matrix() %>%
  st_multipoint()

# intersect the points with outline
spatial_intersection <- st_intersection(spatial_outline,spatial_points)

# export the intersected points
data_intersection <- spatial_intersection %>%
  as.matrix() %>%
  as_tibble() %>%
  setNames(.,nm = c('x','y')) %>%
  mutate(clr = sample(LETTERS[1:5],size = length(x),replace = TRUE))
  data_intersection
}
Let’s see:
create_inner_points(n = 100, data = hypoimg::hypo_outline) %>%
    ggplot(aes(x,y))+
    coord_equal()+
    geom_shape(data = hypoimg::hypo_outline,fill = rgb(0,0,0,.4),color='black') +
    geom_point()+
    theme_void()
I’m lazy and also Hadley Wickham doesn’t like me repeating myself - so let’s pack up the plotting in a function:
splinter_fish <- function(n = 170,
                          data,
                          direction = 1,
                          palette = 'Blues',
                          expand_inner = 0,
                          expand_outer = 5){
  # include the option to flip the x axis
  # (scale_x_reverse() does no work with the tessellation)
  inner_data <- data %>%
    mutate(x = direction * x)

  # call the function to create random points
  create_inner_points(n = n,inner_data) %>%
    ggplot(aes(x,y))+
    coord_equal()+
    # background shadow
    geom_shape(data = inner_data,fill = rgb(0,0,0,.4),color='black') +
    # the original outline
    geom_shape(data = inner_data, alpha = .2,expand = unit(expand_outer,'pt')) +
    # the fun part
    geom_voronoi_tile(aes(fill = x*y*direction,group = 1L),
                      colour = 'black', bound = inner_data,
                      expand = unit(expand_inner,'pt'))+
    # some colors
    scale_fill_distiller(palette = palette, guide = FALSE)+
    theme_void()
}
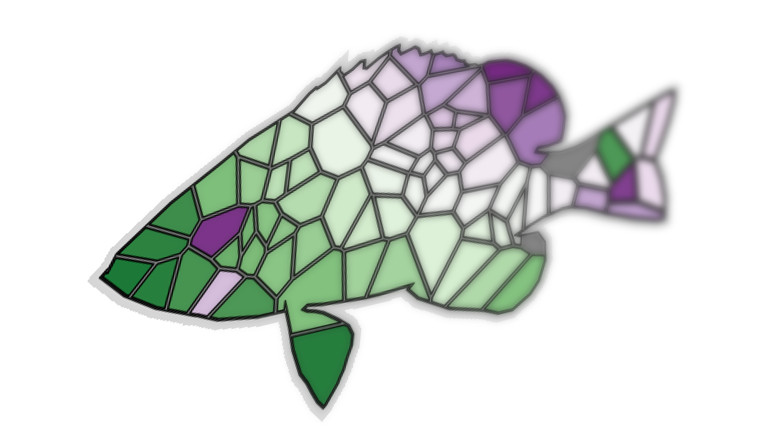
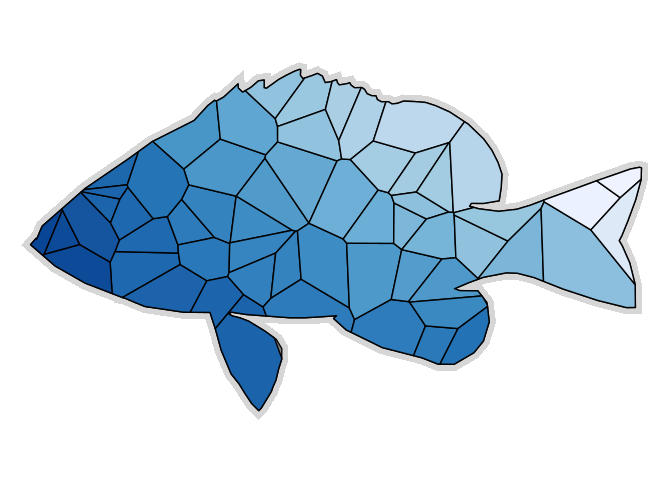
Well, Alt J said it best: “let’s tessellate”!
splinter_fish(n = 120, data = hypoimg::hypo_outline)
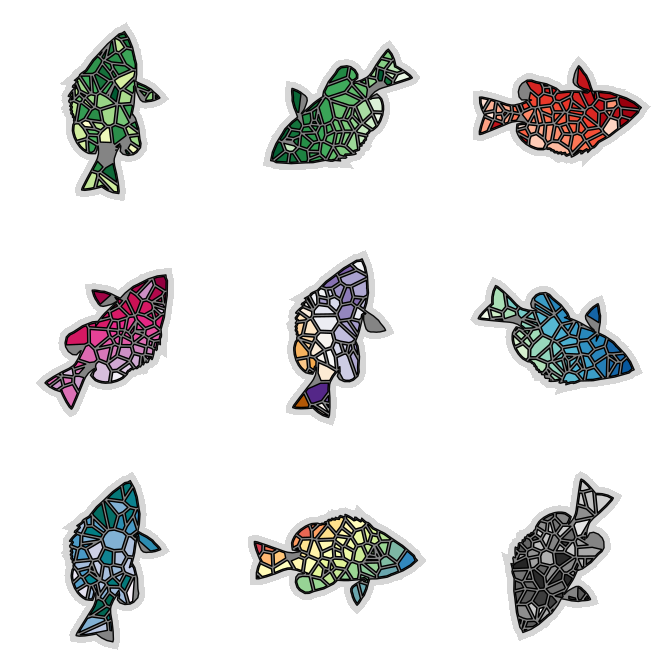
The fun part of reef fish is that they come in many different colors and there are swarms of them:
# our swarm will contain 9 fish
n_plot <- 9

# initialize the swarm (every fish can choose where to look and
# what to wear: the collection includes all sequential and
# diverging palettes from ColorBrewer)
tibble(direction = sample(c(-1,1),size = n_plot, replace = TRUE),
       palette = sample(x = RColorBrewer::brewer.pal.info %>%
                          rownames() %>%
                          .[-c(10:17)],size = n_plot,replace = FALSE)) %>%
  # each fish is plotted
  purrr::pmap(splinter_fish,n = 120, data = hypoimg::hypo_outline,expand_inner = -1) %>%
  # we collect the plot in a tibble
  tibble(plot = .) %>%
  # then we turn the plots into grobs and
  # add an angle and a facet id
  mutate(grob = purrr::map(plot,ggplotGrob),
         angle = runif(n = n_plot, min = -180, max = 180),
         facet = 1:n_plot) %>%
  # finally we plot the
  ggplot(aes(x=x,y=x))+
  hypoimg::geom_hypo_grob(aes(grob=grob,x=.5,y=.5,
                     angle=angle),
                 width=.8)+
  facet_wrap(facet~.,ncol = 3,scales = 'free')+
  theme_void()+
  theme(strip.text = element_blank(),
        panel.spacing = unit(0,'pt'))