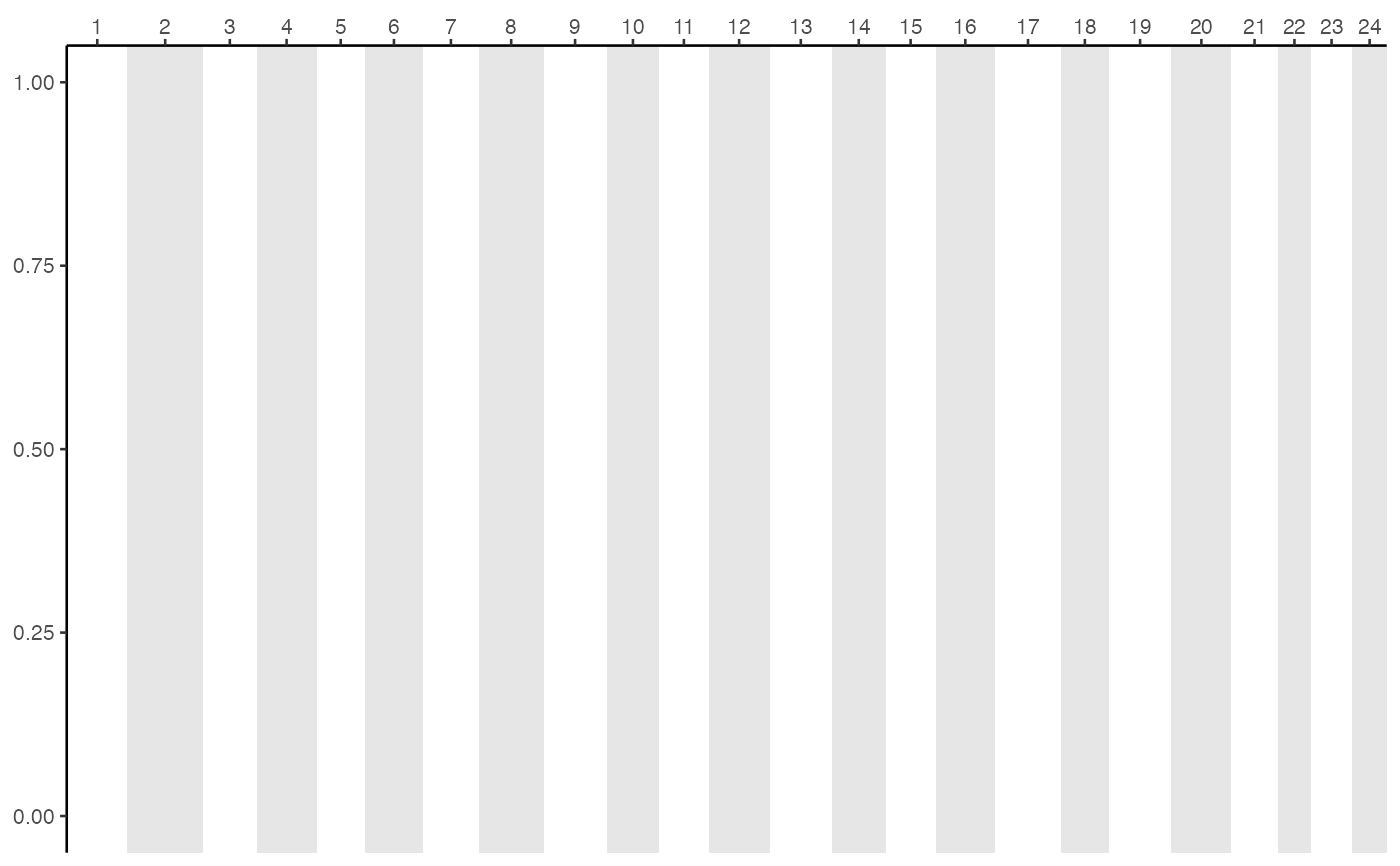
scale_x_hypo_LG adjusts the x axis to match the hamet genome.
scale_x_hypo_LG(
  ...,
  name = "",
  expand = c(0, 0),
  breaks = (hypo_karyotype$GSTART + hypo_karyotype$GEND)/2,
  labels = 1:24,
  position = "top"
)
Arguments
| ... | parameters passed to ggplot2::scale_x_continuous() |
|---|---|
| name | string/ expression, x axis title |
| expand | numeric vector of length 2 |
| breaks | numeric vector, x axis breaks |
| labels | string vector, x axis labels |
| position | string ("top"/ "bottom"), axis placement |
Details
Each of the LGs is labelled with on tick which is placed in the
center of the LG.
The should be combined with hypogen::geom_hypo_LG
See also
Examples
ggplot() +
  geom_hypo_LG() +
  scale_fill_hypo_LG_bg() +
  scale_x_hypo_LG() +
  coord_cartesian(ylim = c(0, 1)) +
  theme_hypo()